Currently I’m consulting to multiple customers who deploy Node.JS app to Azure cloud so I thought of sharing some thoughts and insights as I found the combination of Node & IIS promising and challenging at once. Here it is.
-
Read streaming logs using NODE console
This is one of my favorite features, previously I used to access logs via HTTP and refresh tha page every 2 seconds… it allows you to view streaming log from your web app within NODE console only by typing “azure site log tail”. Cool.
Watch your app logs right within Node console, VS or any other IDE

-
Draw distinct borders between IIS and Node.exe
IIS is a webserver, Node is an execution framework, ideally they would have totally separated and complete each other. In reality, they interfere as both are good at doing middleware work like response caching, authentication traffic logging and more.
Not having a clear responsibility assignment might lead to cumbersome architecture, and ‘vendor-locked syndrome’ (due to over relying on IIS). So who’s responsible for what? I plan to cover this interesting topic in a following post soon, for now I would briefly share my thoughts and say: prefer implementing middleware-related code in Node.JS Express (or any other Node framework), specifically tasks you wish to gain control over. Leave straightforward infrastructural tasks to IIS. This will allow you not only control but easier migration to other platform as most of the logic relies within the code. Going with this rule of thumb, middleware tasks might be assigned like the following:
Tasks assigned to Node middleware (e.g. Express): Response Caching, authentication, etc
Tasks assigned to IIS: Static files, SSL termination, traffic logging, compression, etc -
Explicitly state Node version
If not specified NODEIIS will utilize its default Node.exe version which might or not be similar to your development version. Specifying explicitly the desired Node version will prevent production bugs that are caused by unnoticed differences. It also needed when using ES6 which is compatible with Node 4 and above. The easiest way to tell IISNODE which version is desired is by filling the “engines” element within package.json (see image below)
Stating withing package.json the desired Node version

-
Enjoy Node-Inspector, one of the best node’s debuggers, right on production
Node inspector is one of the favorite debuggers as it utilize Chrome’s developer toolbar for server debugging, you can use it to debug production web app. Set it up easily – ensure that “debuggingEnabled: true” in iisnode.yml then navigate to your site [your domain]/server.js/debug and that’s it.
-
Use cascading configuration using NCong
Storing application configuration might be tricky, some config values are usually set during deployment (e.g. connection strings), others needed to be changed using a management UI or programatically (e.g. dependent micro-service URL) and each set is different in every environment. We came out with the following simple solution that is totally aligned with Node.JS and Azure spirit:
(a) Code modules always read config values from NConf, a repuable NPM package that reads config data from multiple cascading sources
(b) Within the solutions we have a config file per each environment, for example – “config.{environment name}.json”. NConf grabs the environment name from the conventional Node variable ‘process.env.NODE_ENV’. We set the NODE_ENV name in each environment, for example “Production”, “Staging”, “YoniDev”, etc
(c) Finally, we configure NConf to read its config data first from command arguments, then from environment variables and finally from the JSON files. This allows the ops team to override each config key using Azure UI which takes care to hook each key into node variables.A JSON config file for each environment
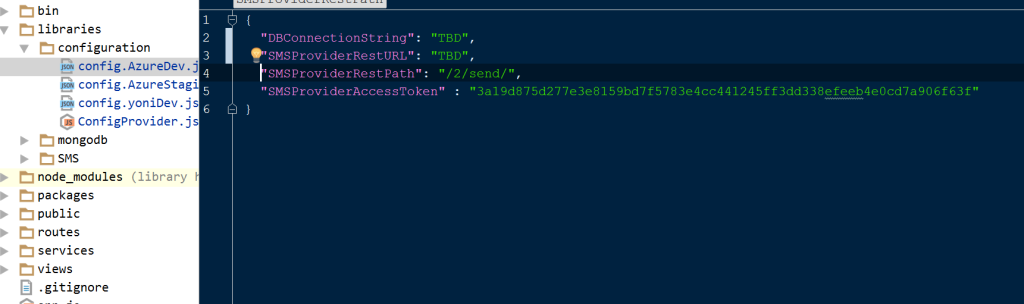
Configuring NCong to read from multiple sources

-
Let IISNODE cluster for you
Unlike self-hosting scenario when taking care of the entire execution model including spawning process per core, IISNODE takes care not only to correlate node’s processes with the VM cores but also to to keep the main process alive more reliably than any other node daemon package (since it lives within IIS which itself lives very deep within Windows). It also take care to auto update when changes are presented (and even let the old-versioned process terminate gracefully) and scale up when more cores are added.
-
Whenever possible prefer Node console over VS/MS tools
Certain tasks can be done using MS tools like Visual Studio and PowerShell, for example: deploying a new version, changing an environment variable, watch the log stream and more. Actually you may code your entire DevOps scripts using PowerShell. However Visual Studio and PowerShell are Azure-specific tools, any investments made in these tools reduce our flexibility to migrate to other platform at the future. The alternative is simple – use Node console whenever possible and makes sense, this technique is applicable among most cloud vendors and makes our workflow almost vendor agnostic. In practice we use Azure command line (set of shell commands) within Node console, though it rely on Azure API (which is obviously not portable to other vendors) it allows us to combine our DevOps scripts with pure Node command and base our workflow on pure Node tools. This also allows to run any commands from any IDE, not only VS.
-
Remember those hidden entris in Web.Config
if you come from the of Node.JS chances that you never heard about web.config which is IIS hierarchic XML configuration files. Since the folks in MS are aware that XML files are not favorite in 2015, they created iisnode.yml file that inherits node related configuration from web.config and allows you to deal with .yml file only. However the web.config file is still required, has entries that affect your app so if you wish to deal with a single configuration file consider getting acquaintance with it. Specifically the following entries should get your attention:
debuggingEnabled=”false” – if turned on allow node-inspector to operate but degrades performance
nodeProcessCountPerApplication – probably your instance has more than one core, set to zero to let IIS handle the number of cores
loggingEnabled – always set to true to get log statements persisted to disc
devErrorsEnabled – if true, on exceptions it will return HTTP status 200 which allow developers to get error details via browser - Use open source services within Azure (e.g. Redis, MongoDB, Docker) Azure offers a wide-selection of open source products that are available as a service like Redis Cache, MongoDB, Docker and others. This is vital for an healthy architecture as it relies of common tools that have great eco-system (e.g. MongoDB tools, extensions, tutorials, etc). It also keeps you away from vendor lock-in -migrating to other cloud provider is much easier when the backbone services are not owned by this specific vendor (e.g. Amazon DynamoDB, Azure Queue)
-
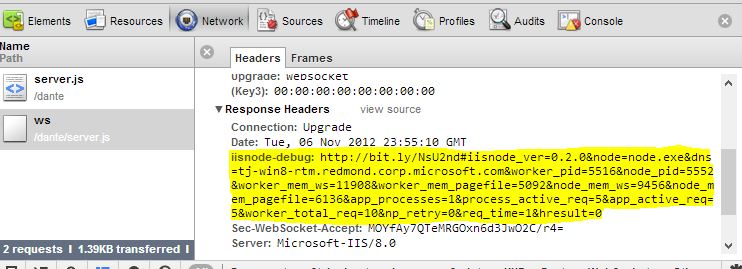
Get quick server diagnostic from client side
This one is an ‘hidden gem’ that allows to get some sneak peak into the server state on the client side using any too that displays response headers like Chrome developer toolbar. Just allow this in IISNODE.yml using the configuration key “debugHeaderEnabled: true”, load any URL and watch within the response a selection of server properties, see image below
Response header showing various server-side data